New MID workbook coming this year
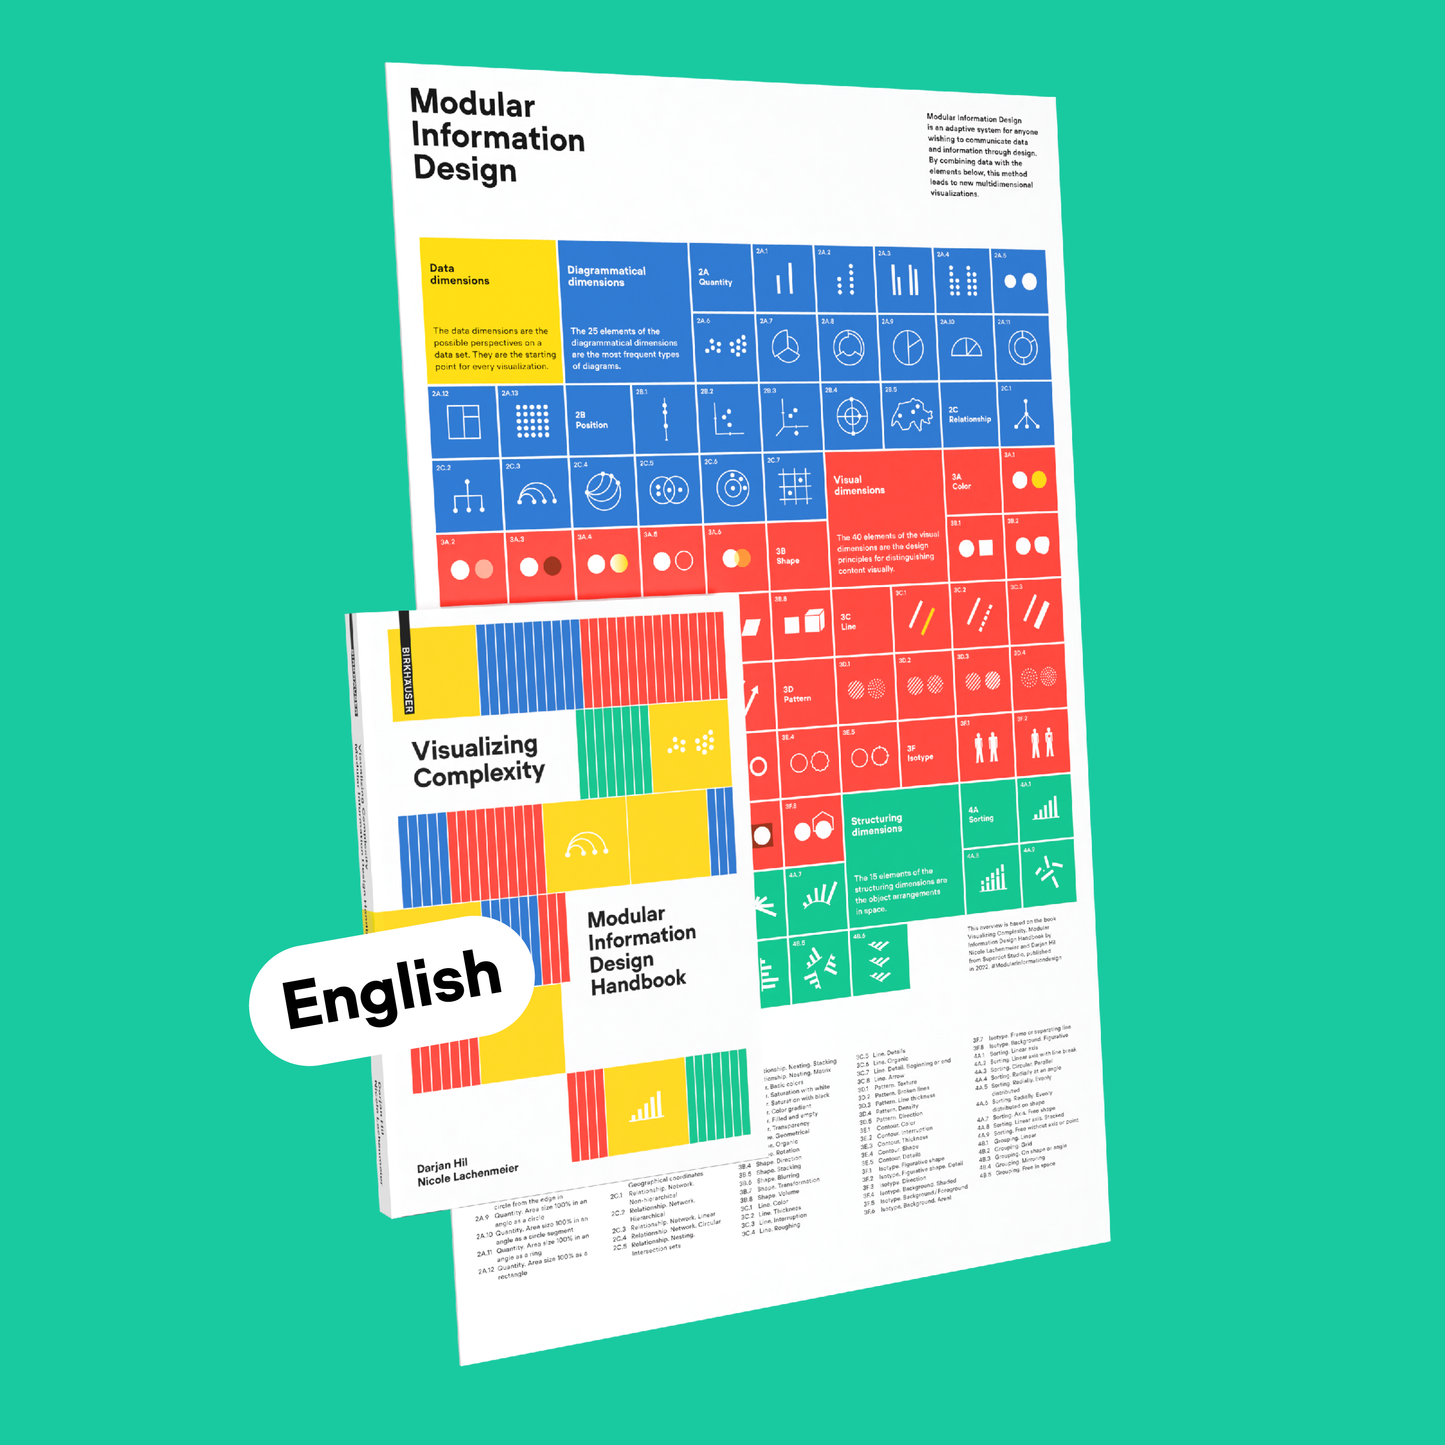
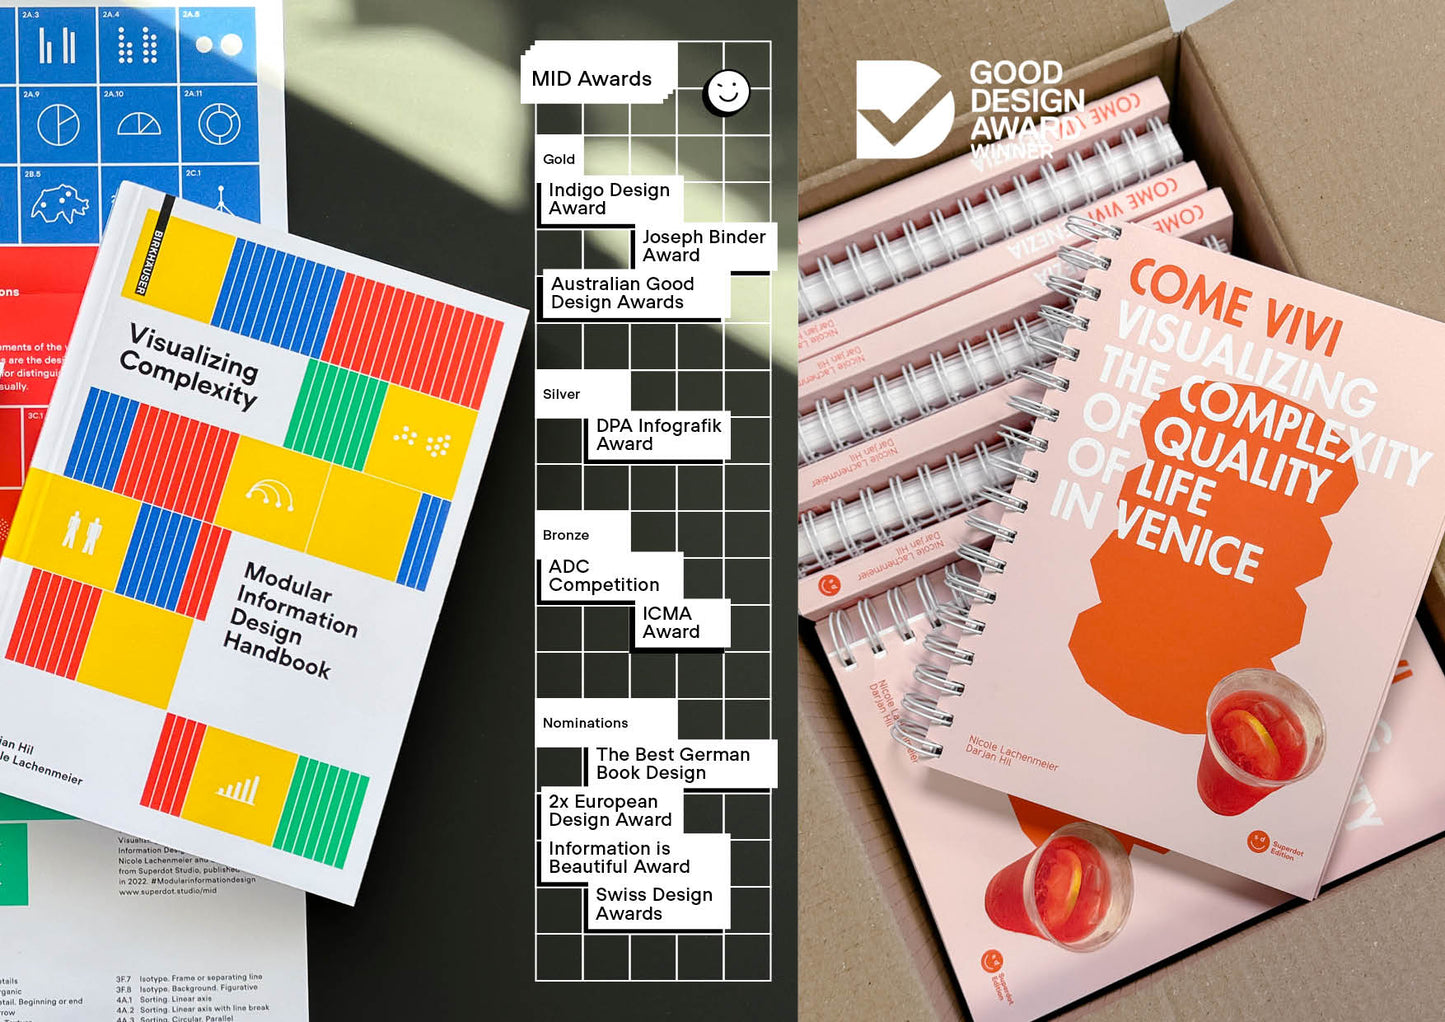
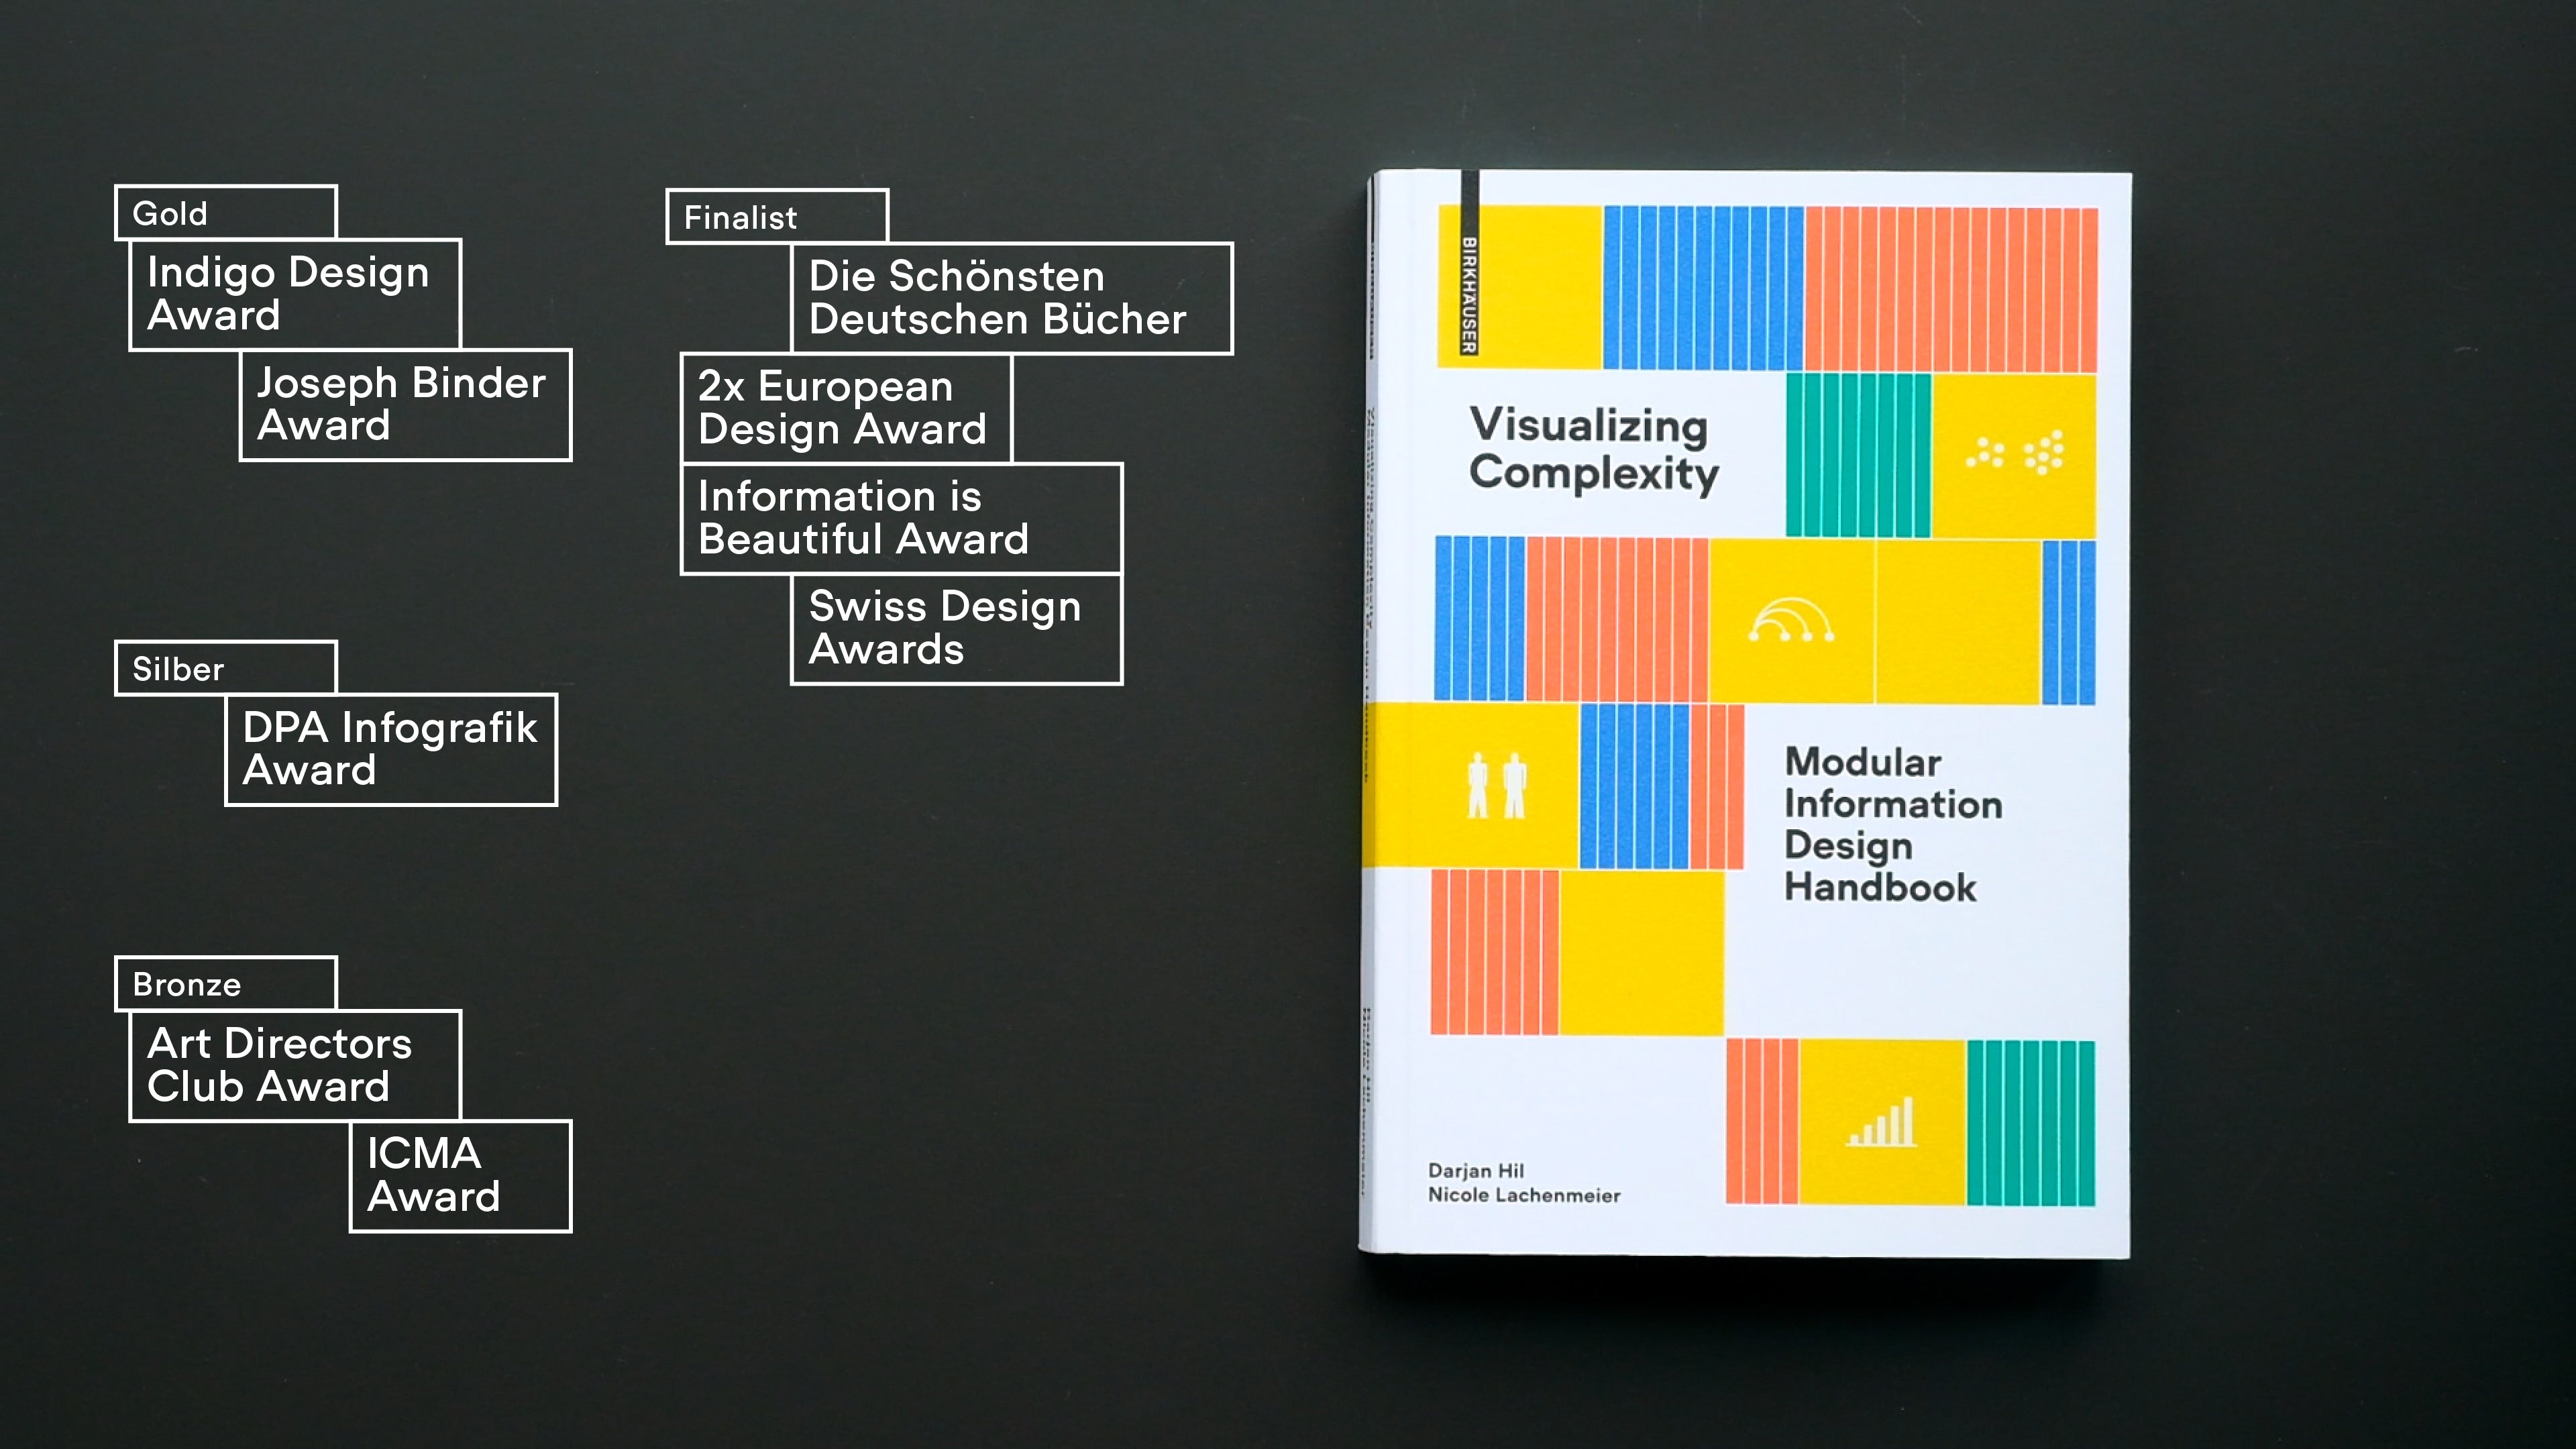
Visualizing Complexity is nearly sold out: the English edition is gone, and only 4 German copies remain. Our new MID workbook is coming this year. Sign up to get the free MID preview and be first to hear when the workbook launches.
By signing up, you agree to receive occasional updates from Superdot on the new book. You can unsubscribe anytime.


Who We Are
MID was developed by Darjan Hil and Nicole Lachenmeier from the information design studio, Superdot. We're experts in explaining complexity through the language of design. We take complex information, visualizing it in a way that audiences can understand.
Because our field is still in its infancy, we wish to inspire and educate, providing guidance for creating information design projects. We share knowledge from over 10 years of practice and teaching to support the growth of the information design community.